Here is my first stab at creating an infograph. Took nearly 2 hours to get comfortable with the piktochart editor and create it. I should say piktochart is very powerful in getting the data easily visualized with its chart selector. There are quite a lot of different options like Swatch, Icon Matrix along with the usual line, bar, pie, doughnut charts in the free version.
Also, their icon collection is very nice. Was able to find some icons where even the iconfinder failed me.
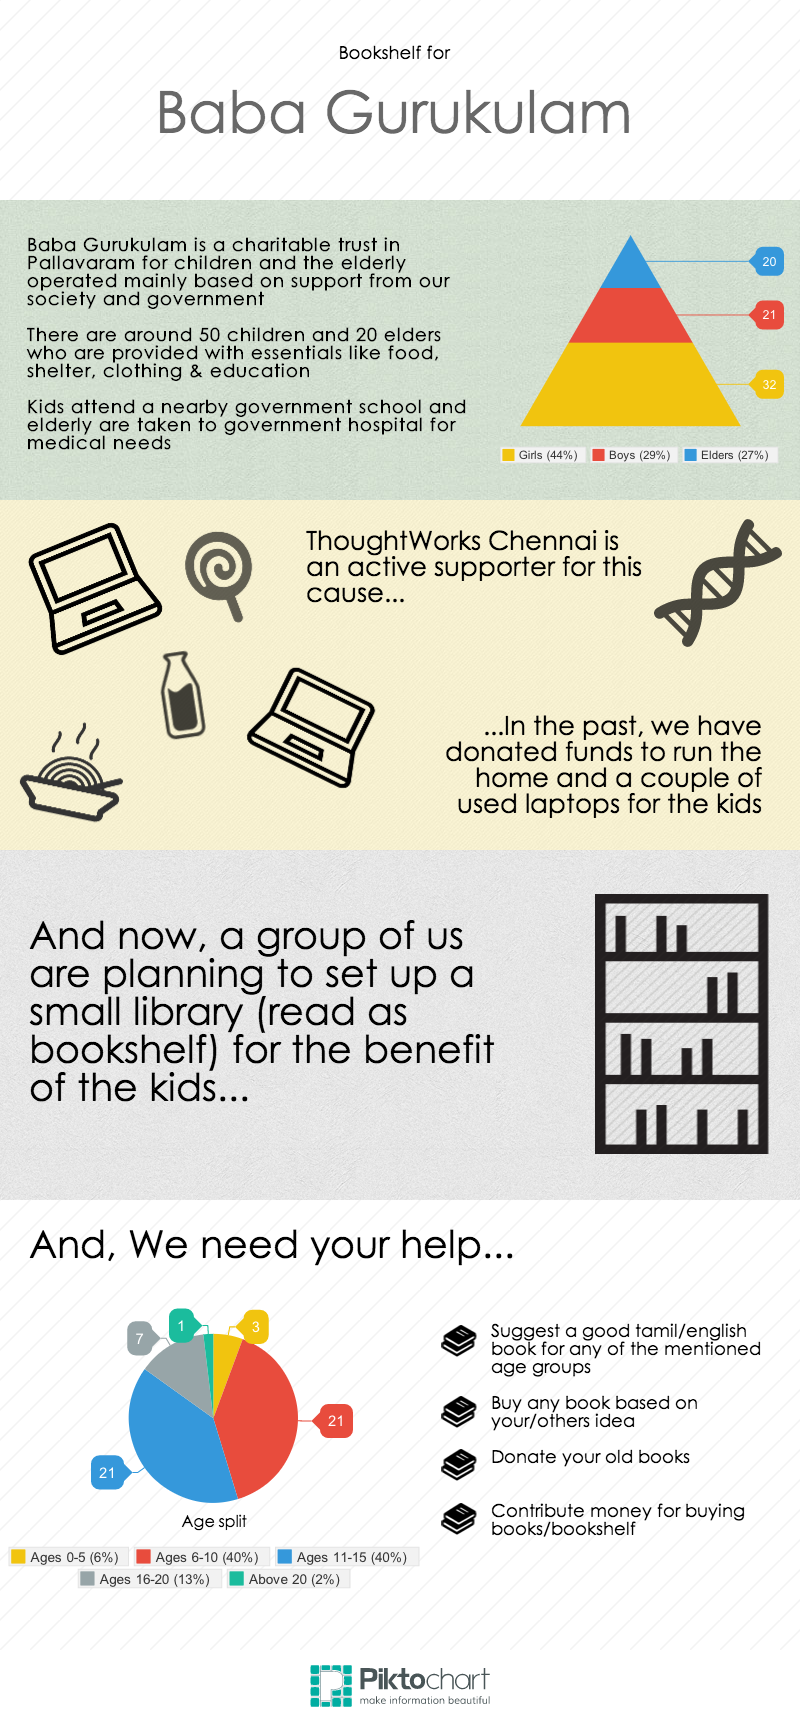
I did this to raise funds for setting up a small library of good books for a home in pallavaram called Baba Gurukulam